Harmonic Analysis Course – Shark Pattern
Harmonic Analysis Course – Shark Pattern
shark pattern
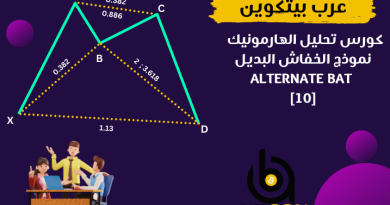
The Shark is a 4-dot pattern and is essentially an emerging 5-0 pattern. In a perfect shark pattern, the BC leg should be a 1.130 to 1.618 extension from the AB leg, the CD leg should be a 1.618 to 2.240 extension from the BC leg, and the D point should be .886 to 1.130 retracement/extension from the AC leg.
The polygon model is 0XABC, this is the global drawing used for the model, but to simplify the process we will redraw the model using XABCD
The Shark model is a new harmonic model first released by Scott Carney in 2011. Although Scott Carney had been familiar with the pricing structure for some time, he needed to refine the defining criteria to uncover the best opportunities.
In essence, the pattern is the basic structure that precedes the 5-0 formation. This structure is outside of the typical M and W frame. It possesses a unique formation called the extreme harmonic impulse wave that retests the identified support/resistance during the convergence at the 0.886 retracement area – and the 1.13 extension.
In all cases, the completion point must include a strong 88.6% support/correction as a minimum requirement. Also, the unique maximum harmonic wave uses a minimum expansion of 1.618.
This combination with the 88.6% correction defines a unique structure that has two low harmonic scales to determine the bottom level. In many cases, price action will retest the pattern’s initial starting point and identify excellent opportunities to profit from a market that has been moving too quickly for a limited period of time.
These structures usually have overly extended price action using the “normal” state of an intense harmonic impulse wave, which is usually categorized as regressive trading behavior.
This pattern often identifies excellent opportunities, but these setbacks are often severe and require specific management strategies to capitalize on the phenomenon.
In many cases, the price action will retest the previous support/resistance level and usually result in limited reversal movement. This structure should be treated differently than the standard M and W patterns. In fact, the overall prediction of price action should be short-term and try to take advantage of the clearest opportunities.
The shark pattern leads to many subtle and aggressive responses that can be successfully traded as long as more active management is employed.
Trading the Shark Pattern
The shark pattern represents a transient extreme structure that attempts to exploit the extended nature of an extreme harmonic impulse wave. As it precedes the 5-0 level, the last Fibonacci level of 0.5 represents the optimal profit target. Once implemented, the position requires an active trade management strategy.
Confirmation at the pattern’s completion point requires a sharp change in price action character immediately after testing the lower boundary of the 88.6% retracement and the maximum harmonic impulse wave of 1.618.
After being tested, the price action usually shows a change in trend, which can be quite choppy. As long as minimal procedures are tested, a reversal can be expected quickly afterwards.
It is common for price action to breach lower levels, but the general determination of the pattern’s validity depends on the price action at the time of the close.
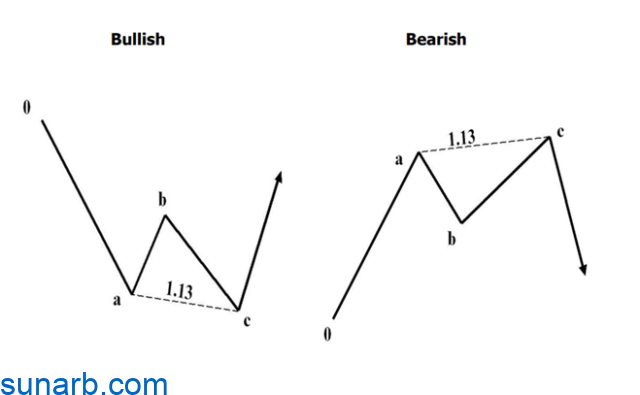
Expansion 1.13 – Failed Wave
The 1.13 extension usually represents a failed breakout or breakout of a previous resistance or support point. The harmonic ratio of 1.13 is the reciprocal of 0.886 and is also important in certain situations. The 1.13 ratio represents a critical structure outside of the M and W types and is effective in identifying divergent reflections.

Correction of point C of abdominal bone = 1.13 (we draw Fibonacci from point A to point B)
A divergent reversal is indicated when the secondary test does not have the strength to continue in the direction of the primary trend. The 1.13 extension represents a check or break level in multiple retests with obvious support and resistance. Indeed, price action will continue past the critical extension level of 1.13 well into the 1.27 or 1.618 areas.
Harmonic impulse waves
Harmonic impulses are sharp, short-lived price movements that stick to certain ratios. These structures must be treated the same as complex patterns because they are unique structures outside the scope of M and W structures. These configurations are most accurate at specific conformational positions.

Point B correction from XA track = 1.13 – 1.618
Correction of point C of AB leg = 1.618 – 2.24
Starting from the previous 0XABC segment, the harmonic impulse waves are a rapid extension to the minimum of 1.618 to the limit of 2.24. This structure is a critical component of the Shark model and 5-0 patterns.
Shark Pattern Management
Because the Shark model is a reactive trading opportunity, it requires an active – if not automated – management strategy.
Optimal profit targets should expect a 50-61.8 ratio response to test the 5-0 pattern’s Probable Reversal Zone (PRZ). Specifically, the shark pattern’s initial profit target should be below the 50 Fibo ratio level or the reciprocal AB=CD pattern, whichever comes first. Usually, the initial profit target is the first price measurement in the potential reversal zone (PRZ) of the 5-0 pattern.
Although other discretionary strategies can be used to determine whether the trend reversal is as large as possible, shark pattern management attempts to automatically capture the price segment with the highest probability. Although it can be difficult to automatically lock in win targets, it is important to maximize these opportunities in this pattern. Although Scott Carney published this pattern years ago, in this article we’ll break down the key differences that improve these choices.
shark model Bullish Shark Pattern
The drawing model below with the 0XABC pages is the global drawing used for the model, but to simplify the process we will redraw the model using XABCD


Shark pattern jumps
- point correction B From the XA section at 0.382, 0.5, 0.618
- point correction C from the rib AXE if 1.131,618
- point correction D from the rib B.C at 1.618, 2, 2.24
- point correction D from the rib xc at 0.886, 1.13
The Shark pattern is a 4-sided pattern that is basically an emerging 5-0 pattern. In an ideal shark pattern, the point C retracement of the AX section should be from 1.13 to 1.618 and the point D retracement of the BC section should be from 1.618 to 2.24, and the point D retracement should be 0.886 to 1.13 are the XC extension.
It is important to note that an additional scale has been added at this point B So we note the correction point B Out of SHAH It is 38.2-61.8. Since this is outside of the normal M and W scales, it helps distinguish shark model structures as valid possibilities.
The Shark model is an excellent structural configuration, but it requires some specifications to avoid invalid possibilities.
The main technical event is a retest of the prototype point at X. Depending on the lunge, a measurement is taken xc After the 88.6 patch test. There may be some volatility if the price action breaks the 1.0 level and hits 1.13, but it depends on the impulsive structure. , the fundamental price event characterizing the pattern is a sharp retest of the starting point that exhibits some strong harmonic interaction phenomena.
Possible reversal zone (PRZ) of the bullish shark pattern
The shark pattern defines a unique assemblage of impulsive and retrograde harmonic structures that provide a final input. A possible bullish reversal area identifies harmonic support in the same area as the initial dot pattern retest.
Essentially, this alignment of structures identifies a buying opportunity with firm support. Although the 88.6% retracement is an important side consideration, the biggest focus should also be on the price action around the 1.0 AB level.

The key in deciding whether to run at a retracement of .886 or an extension of 1.13 is to analyze the impulsive minimum extension of 1.618.
Depending on where this completes, it will determine if the shark pattern will complete at the previous initial low or if there will be a case of price action extending to the 1.13 level.
If the lower impulse wave 1.618 ends before the 88.6 retracement, 2.0 or 2.24 is used to better complement the harmonic support.
Regardless of how much price action is traded outside of the lower levels, the key in all reversals is to see explanatory price action that continues in the opposite direction after the pattern completes.
Bearish Shark Pattern
The key to identifying the bear shark is to distinguish the minimum impulse rib relative to retesting the prototype point at X.
Depending on where the lower boundary of the impulsive section ends at 1.618, the extent to which the price action crosses the pattern’s starting point can be clearly determined.

Possible reversal zone (PRZ) of the bearish shark pattern
In general, price action in the area of a potential reversal requires confirmation at the time of pattern completion, but the general determination of whether the reversal will be a retracement at the 88.6 level or an extension at the 88.6 level 1.13 XC The rib motif is specified. In most cases, I would expect the shark pattern to retest the pattern’s starting point (1.0 XC). Therefore, price moves beyond the 88.6% level are common in these structures.

Summary of the Shark model
The Shark model is a distinct structure, but differs from the types of the harmonious M&W models. The completion of the hull serves as a precursor to the 5-0 model. Thus, these two models are related, especially since 5-0 is the optimal win target for the shark model.
The shark pattern is doing very well to retest the previous support/resistance points (0.886/1.13) as a strong countertrend reaction opportunity that offers clear but short-term moves. Remember that the extended harmonic impulse wave B.CIt should be at least 1.618 (can go as high as 2.24), but it’s usually maximum price action.
1.618 will act as the last price point in the structure while testing the floor of the 88.6 XC retracement.
The 1.13 XC expansion is the limit you shouldn’t cross. Most importantly, execution in the Shark pattern’s potential reversal zone (PRZ) is dependent on the price action as it tests the lower levels. The reversal can unfold after minimal action, but the stop-loss area should be created right after the 1.13 extension. Due to the nature of the reaction, it is necessary to automatically hit the win target on the first reading at 5-0 within the potential reversal zone (PRZ).
Lesson 7: Pattern AB=CD نموذج
Lesson 8: The Gartley Model
Lesson 9: Bat Model
Lesson 10: Alternative bat
Lesson 11: The Cancer Model
Lesson 12: Deep Crab
Lesson 13: Butterfly Patterns