Arabic Bitcoin | Harmonic Analysis Course – AB=CD Pattern
Arabic Bitcoin | Harmonic Analysis Course – AB=CD Pattern
1 – AB = CD.model
AB = CD .model elements
- model AB = CD It’s a 4-point pricing structure, which is the minimum requirement for most harmonic pattern setups.
- model AB = CD It is a structure composed of two parts of equal price and harmonious proportions.
- Exact completion point for AB = CD It is the main price level while the BC projection completes the range.
- Point C is the chosen level of completion of the model and the establishment of the inverse ratio.
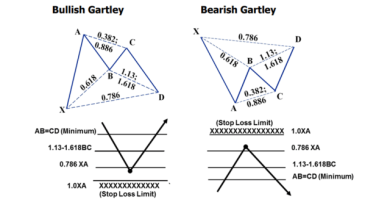
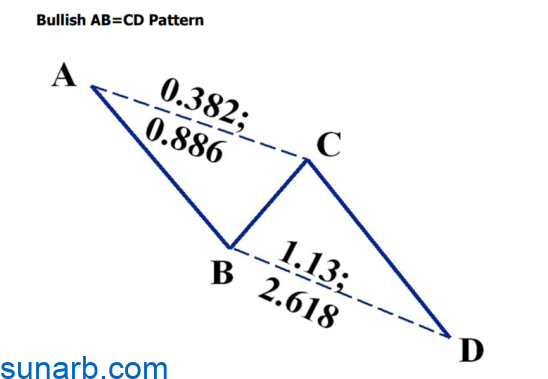
AB=CD purchase pattern

Bullish structure AB = CD is the minimum component in each pattern possibility. The essential element of all valid patterns is found in the characteristic symmetry of the formation. The harmonious proportions that make up the structure are important to complete the completion point of the model. The BC projection measurement is also crucial for confirming the completion point of the structure. Although the AB=CD closing point is the most important minimum for any pattern viewing, it is usually breached when the price action tests the entire support area.
AB=CD sales pattern
The next bearish figure represents a significantly lower target in all M and W formations. The structure must be clear and have a limited range of BC ratio forecasts to complete accurate completion.

Harmonious Relationship -> Mutual Relationship
The commutative relationships are based on the inverse relationships of correction versus elongations. These are generally used to measure and complete pattern completion points. With regard to the AB=CD structure, the correction ratio can determine the expected range scaling. We’ll look at these relationships in detail when we review the 5-0 model, but for these purposes we’ll review their importance.
| renewal | traceability |
| renewal | Revision |
| 3.618, 3.14, 2.618, 2.24 | 0.382 |
| 2 | 0.5 |
| 1,618 | 0.618 |
| 1,414 | 0.707 |
| 1,272 | 0.786 |
| 1.13 | 0.886 |
| 2 | 1 |
AB = perfect CD model
The most consistent and consistent of all structures is the perfect AB = CD model.
Although other ratio combinations give correct starting points, this particular structure was originally identified in Scott Carney’s Harmonic Trading Volume 1. It used to provide a number of perfect pattern alignments, but the most important of all is the basic AB = CD structure with The harmonic ratios are 61.8% and 161.8%. In fact, perfect model alignments represent the most perfect structures when related to harmonic relationships. It is clear that the AB = CD component is significant for all structures, but without the harmonic ratios of the 0.618 and 1.618 scales, for example, we will simply evaluate the random structures. We know that these elements are necessary to define structures as consistent.
The premise of harnessing the natural cyclical phenomenon in financial markets requires that we respect metrics and execute trades at specific levels. Ideal structures give us the ideal symmetrical model that comes closest to what the natural model shows. In general, these measurement structures can be overlaid with real-time scenarios, with deviations from the ideal occurring.
This guides decisions and provides accurate information on the trend to improve execution, reduce risk and increase profit. Therefore, these ideal structures give us unique situations that have greater potential than other patterns. However, there are usually fewer options.
BC layering technique
A useful consideration about the secondary measurement is to evaluate the larger probabilities using the secondary BC measurement in each pattern. This may be slightly different for each ratio combination, but there are other supplemental metrics that help create more specific execution areas when using two BC metrics. When we talk about the initial BC measurements, in most cases the focus is on completing the basic AB = CD structure. These are useful in the clearest cases and offer the best integration with the most obvious ancestral groups. For example, an AB = CD structure with a span of 1.13 is quite narrow. However, the 1.27 level effectively complements these pattern types. Although the AB = CD point is breached in most instances of the pattern, measuring the levels determines the allowable level of price action tolerance to breach this area.
AB=CD purchase sample with BC layering technique

Although the technique can be applied to any harmonic ratio that defines patterns, certain combinations of scales are more effective than others. I’ll show some basic relationships and try to keep them simple. I can run through dozens of possibilities, but I feel that the basic concept can be better represented in cases of perfect harmonic proportion.
By using the most popular BC layering method using the BC 1.618 and 2.0 extension with the AB=CD pattern, we can create an effective differential to facilitate support/resistance decisions. In the bullish harmonic support area, the extension of BC 1.618 will precede the exact close point pattern. In these situations, AB = CD is the most important point within the range, but real world trading action can go beyond this range. At this point, the 2.0 BC benchmark measures the extent to which the opportunity can tolerate this trade beyond the ideally measured level. In other cases, the BC layering method can also help improve stop-loss actions.
Possible reversal zone (PRZ) of AB=CD buying pattern مع BC layer technique
Since AB = CD is the mandatory minimum, it is common for price action to exceed this area on the initial test, indicating that a potential reversal area will not be valid support. We’ll look at confirmation strategies later in this series of articles, however, an additional layer of BC at the point of model completion adds a degree of accuracy to these situations.

Also sell the AB=CD model method BC layering technique
In the bearish harmonic zone, the extension of BC 1.618 will just precede the pattern’s completion point. In these situations, AB = CD is always the most important lower target within the range. At this point, the 2.0 BC benchmark measures the extent to which the opportunity can tolerate this trade beyond the ideally measured level.

Possible reversal zone (PRZ) for the Sell AB=CD pattern مع BC layer technique
AB=CD is the mandatory minimum but is usually exceeded. The initial test will validate the potential reversal area as a key resistance. An additional BC layer creates additional tolerance to gauge price action when the pattern completes.

2 – model AB = CD Alternatively AB = CD
Alternative Projections of AB=CD Although AB=CD is a great setup when each leg is exactly the same, there are many situations that require alternative Fibonacci calculations to clearly identify a potential reversal area. Although a clear pattern may develop, it is not uncommon for AB = CD to be unequal. These alternative projections must complete a range of other harmonic numbers. As I will discuss in the patterns section, these alternative predictions are effective in identifying potential reversals.
Pattern AB=CD Extension 1.27 or 1.618 If AB=CD is exceeded, an extension 1.27 or 1.618 can be used to identify other potential PRZ reversal points. It is not difficult to calculate these alternative accounts. Depending on the number used, multiply the AB intercept by 1.27 or 1.618 and project that distance from point C. This calculation should converge to the Fibonacci projection – typically 1.618 or 2.24 of the BC intercept.
model AB = CD Alternatively AB = buy CD
The Alternate AB = CD buying model was derived from Scott Carney’s research on structural differentiation. In patterns like the Alternate Bat and the Crab, this extended formation was a reliable measure when an equivalent AB = CD probability was not appropriate.

Alternate AB = CD Alternate AB = Sell CD
As we define the various bases for pattern structures, these alternative types for their most effective situational application become readily apparent. Simple awareness as a higher alternative probability and beyond the parabolic pattern also provides price targets when price action crosses the minimum close point.

Tolerance rating with B. point
One of the first breakthroughs in a classification of M and W modulation types was to determine their orientation with particular reference to point B. The structural variance AB = CD was an important price differentiation to distinguish similar probabilities.
1- +/- <3%: One of the first M&W skeleton variants I differentiated was the Gartley model vs. the Fledermaus model. Essentially, the initial research showed that Gartley only worked when point B was close to the 61.8% limit. We'll look at the specs later in this chapter, but the results are profound. My research proved that Gartley structures that had a B point that was +/- 3% of the ideal of 61.8% created opportunities with greater potential. This means that any M or W structure with a B point between 58.8 and 64.8% has a valid tolerance for deviations beyond the ideal scale for validation as a harmonic pattern. In all other cases, a bat pattern is typically used when it is less than 3% tolerance or becomes invalid above the upper limit. I must emphasize that this strict definition also applies to the butterfly pattern. These small differences were useful in eliminating those structures that look similar but don't have the right proportions to check for consistency.
2 – +/- <5%: For most other structures, a 5% tolerance is applied to the B points. Although Gartley and the butterfly are rigorous examples, a 5% tolerance at point B is effective when analyzing bat patterns, and the crab in particular. Again, the purpose here is to categorize the type of structure we are generally dealing with, but the tolerance limit goes a long way in identifying a finite number of valid possibilities.